+ Reply to Thread
Page 1 of 2 1 2 LastLast
Results 1 to 10 of 14

Thread: Pump Efficiency, Head, Flow, and related technical info

  1. #1
    chem geek is offline PF Supporter Whibble Konker chem geek 4 stars chem geek 4 stars chem geek 4 stars chem geek 4 stars
    Join Date
    Nov 2004
    Location
    California
    Age
    65
    Posts
    2,226

    Default Pump Efficiency, Head, Flow, and related technical info

    I'm adding this thread in The China Shop to move the more technical discussion that was originally started in this thread at post #14 and should get moved into this thread so that we can continue the discussion without scaring off newbies. Any net results or simple rules can be posted back into the original thread, but here in this thread we are free to use the mathematics of fluid dynamics and statics.

  2. #2
    chem geek is offline PF Supporter Whibble Konker chem geek 4 stars chem geek 4 stars chem geek 4 stars chem geek 4 stars
    Join Date
    Nov 2004
    Location
    California
    Age
    65
    Posts
    2,226

    Default Re: Pump Efficiency, Head, Flow, and related technical info

    Mark,

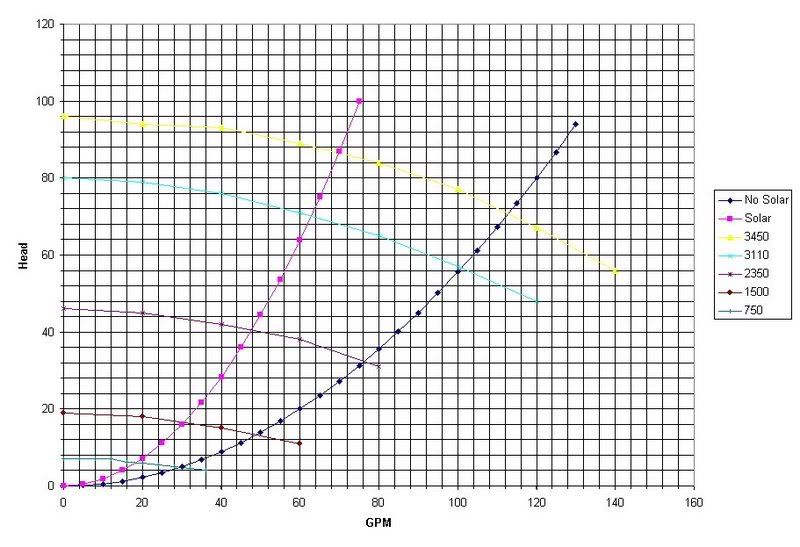
    I also made a spreadsheet which is how I came up with the formula, and I carefully measured the graphs with a ruler to get reasonable accurate numbers. My data, from both the full IntelliFlow and the IntelliFlow 4x160 graphs, is as follows:
    (I'm continuing to edit this to straighten out the columns)
    Code:
    GPM  Head  Out. Power  In. Power  Eff.  (RPM/350)^2-(GPM^2)/470
         (ft.)                                           (RPM/322)^3+80
    3450 RPM
      0   96      0          1310     0.0%  97.180164    1310.277154
     20   94    353.7502     1620    21.8%  96.32910017
     40   93    699.9738     1930    36.3%  93.77590868
     60   89   1004.8011     2210    45.5%  89.52058953
     80   84   1264.4688     2510    50.4%  83.56314272
    100   77   1448.8705     2780    52.1%  75.90356826
    120   67   1512.8466     2980    50.8%  66.54186613
    140   56   1475.2136     3010    49.0%  55.47803634
    
    3110 RPM
      0   80      0                         78.95591837  980.9766836
     20   79    297.3007                    78.10485454
     40   76    572.0216                    75.55166305
     60   71    801.5829                    71.2963439
     80   65    978.458                     65.33889709
    100   57   1072.5405                    57.67932262
    120   48   1083.8304                    48.3176205
    						
    2350 RPM
      0   46      0                         45.08163265  468.7191816
     20   45    169.3485                    44.23056882
     40   42    316.1172                    41.67737733
     60   38    429.0162                    37.42205818
     80   31    466.6492                    31.46461138
    				
    2070 RPM
      0   35      0           330     0.0%  34.97877551  345.6705539
     20   34    127.9522      450    28.4%  34.12771168
     40   32    240.8512      550    43.8%  31.57452019
     60   28    316.1172      630    50.2%  27.31920104
     80   22    331.1704      690    48.0%  21.36175423
    
    1500 RPM
      0   19      0                         18.36734694  181.0895264
     20   18     67.7394                    17.51628311
     40   15    112.899                    14.96309162
     60   11    124.1889                    10.70777247
    
    950 RPM  chart said 750, but was probably wrong
      0   7       0                         7.367346939  105.6804838
     20   6      22.5798                    6.516283109
    
    690 RPM
      0   4       0           95     0.0%  3.886530612   89.83965015
     20   3      11.2899      95    11.9%  3.035466782
    I do not get the same data you do in your table for actual GPM. For example, at 3450 RPM and a head of 80 feet, the graph looks like this is 90 GPM, not the 97 "Actual GPM" shown in your table. I understand the pump affinity equations that are valid in regions of equivalent efficiency. I just was curiously looking for a general solution. I believe what I said before to be true, that the formula I came up with is within 1-2 feet of head in accuracy which probably means that it is accurately reflecting what is going on -- a static head based on RPM^2 minus a dynamic head based on GPM^2. The "static head" is really a balanced dynamic head between the motor pushing water one way and it leaking at the same rate the other way. The GPM^2 term appears to just be the dynamic head of the net amount of flow through the pump so while the RPM^2 "push" amount remains constant (since we are looking at a curve at constant RPM), the "leakage" amount decreases as the head decreases so that a net GPM increases. Or another way of looking at it is that the pump RPM is pushing water at a GPM determined from (RPM/350)^2-(GPM^2)/470 = 0; GPM = sqrt(470*(RPM/350)^2) = RPM/16.1 so at 3450 this is 214 GPM. So the pump's RPM (and impeller size) cause 214 GPM to move when there is no head. Any resistance (head) results in a backward "leakage" which causes the net GPM to drop (since this backward movement meets a lot of frictional resistance), but 214 GPM is always being moved "forward" by the pump even when the net GPM is 0 (meaning that the "leakage" is also 214 GPM so no net movement is seen). At least this is my best understanding of how this works. I don't have the pump curves (for this pump) going down towards 0 head, but I have seen other pumps' curves that do appear to have the parabolic shape (see this link, for example).

    Regardless of which formula is used, I also wanted to estimate the electrical efficiency and that has been harder to determine. Unfortunately, only 3 RPMs showed electrical power curves on the graph so my best-guess formula isn't validated very well, but it does appear to roughly be a combination of some small fixed losses (resistance, probably) plus an amount of "work" that is related to the cube of the RPM. This makes sense since the velocity of water is proportional to the RPM as is the GPM (as shown with the formula in the previous paragraph) while the frictional losses (i.e. head) are roughly proportional to the GPM^2 so the power is expected to be the product of the flow rate times head so proportional to GPM^3 and since GPM and RPM are directly related, this is proportional to RPM^3. What is harder to figure out is how the electrical power doesn't track the output power or the amount of head as might be expected. It instead seems to have a linear increase with net GPM and then slows down its increase as it approaches around 50% efficiency. I would presume that eventually as output power dropped at lower GPM, that the electrical power would start to drop as well. The electrical power should be directly related to the pressure resistence against the impellers (I'm assuming a constant RPM) which is a difference in pressure on one side of the impeller compared to the opposite side. So normally one would expect the electrical power to be proportional to head alone, but apparently the "leakage" causes some of the pressure on the opposite side of the impeller to be higher so that the net difference isn't the full amount of head (so there is less net pressure and therefore less "work"). As the head declines, the leakage also declines and apparently reduces the pressure on the opposite side of the head faster than the overall head drop so that there is a net electrical power increase. Near the point of optimal efficiency, these two effects act so that the amount of electrical power tracks the output power (near 50% efficiency) which essentially means that the "leakage" reduces the back pressure faster than the drop in overall head, but at a rate that is similar to the output power. I suspect that in the region at lower head and high GPM that the electrical power drops in rough proportion to the head since the "leakage" effect would be much smaller at that point. So, at very low head, the pump curve should be near vertical instead of the parabolic formula that I came up with (assuming that the leakage becomes minimal at low head). It seems like I'm missing something here, at least for figuring electrical power -- either that or it truly is as complicated as it sounds and not easily computed.

    Richard
    Last edited by chem geek; 01-22-2007 at 03:20 PM.

  3. #3
    mas985's Avatar
    mas985 is offline Lifetime Member Whizbang Spinner mas985 3 stars mas985 3 stars mas985 3 stars
    Join Date
    Dec 2004
    Location
    Pleasanton, CA
    Posts
    1,423

    Default Re: Pump Efficiency, Head, Flow, and related technical info

    It was probably a good idea to move this thread into the china shop. It was starting to get a bit heavy for the construction forum. Not too many people want to get into the details of hydraulics so I usually give simple approximate answers. But I tend to get a better understanding of rules of thumb by getting into the details. On to the discussion at hand………


    Curve Fitting

    Taking data off of a picture is bound to generate significant errors depending on who does it and how. However, I went back and looked at the chart again, I enlarged the head graph, placed grids over it and I got closer to 95 GPM so I think we are both reading it differently. Anyway, I have found that printed graphs tend to be somewhat inaccurate as well as difficult to read and I bet if you got the data directly from Pentair in tabular form, you might find it different than what is on the graph.

    Static Head

    Next, I wanted to more clearly define static head so there is no confusion. The classical definition of static head loss in hydraulics is vertical lift or how far the pump must lift the water in a pipe to a different elevation. This type of head loss is independent of flow rate, depends only on vertical distance traveled and is not related to pumps at all. Dynamic head loss is the opposite where it depends on the velocity of water and the pipe/fitting it is going through.

    Also, the pump itself will not have any signicant amount static head loss so to describe the head equation as having a static part and a dynamic part is probably not valid. As far as the pump head curve is concerned, a pump does not care if it is subjected to static or dynamic head, head loss is head loss which is resistance to flow. However, a pump responds to different head loss with varying flow rates which is were the head curve comes from. The way I like to think of it is that the pump causes flow, the flow causes head loss in the plumbing, the head loss causes the flow to slow down in the pump and so on. It is circular but can be solved in closed form or by iteration depending on the head loss curve formula.

    Pump Conservation of Energy

    As for pumping theory, total energy within the pump system must be conserved where water flow is only one part of the total energy. So even if GPM decreases, it does not mean the total energy does or that it is somehow lost to “leakage”. The motor delivers energy to the shaft as BHP and the impeller then transfers that energy as both pressure and flow. So full energy transfer equations of a pump are:

    Motor Formula:
    Kwatts (Energy Usage) / .746 = IHP (Input Horsepower)
    IHP * Motor Efficiency = BHP (Braking Horsepower)

    Pump Formula (exclusive of motor)
    BHP * Pumping Efficiency = WHP (Water Horsepower)

    Water Horse Power Conversion Formula
    WHP * 3960 = Head * GPM

    So the total efficiency of a pump is
    Total Pump Efficiency = Motor Efficiency * Pumping Efficiency

    So as head increases and GPM decrease, WHP would be constant if the pumping efficiency stayed constant. This is the reason I started with this equation to model the head curve. However, pumping efficiency is not constant and is dependent on both flow and head, and it usually peaks near the mid point of the head curve. So GPM is not really “lost” at high head due to "leakage" but it's energy is transfered to pressure or high head such that energy is conserved via Head * GPM. So another way to think about it is those "extra" GPMs are staying in the pump housing and creating more pressure rather than leaving the pump to create flow.

    Motor efficiency losses are due to the I^2R losses in the windings, electromagnetic radiation, and friction in the motor. Pumping efficiency losses are due to the friction losses in the pump housing and head losses near the impeller and before exiting the pump housing.

    As you have found, motor efficiency is much more difficult to model than pumping efficiency. Few manufactures, if any, will show energy consumption as a function of motor load. As a general rule of thumb, there is a sweet spot for pumps where the pumping efficiency reaches a maximum for a particular head value and the motor efficiency also reaches a maximum for a particular head value which is usually between (75% -100% of load). Too little or too much load and the motor efficiency goes down. A well designed pump will optimize both and together they will give an optimum efficiency over a range of head values.

    Just getting data on electric motor energy efficiency is difficult at best. It is usually not published or only noted as peak efficiency. A call to the manufacture may get you the data but I have not been successful to date.

    Although it is a noble effort to try and model the pump with great precision, given the uncertainties involved and lack of data, I think a rough approximation of energy savings should be sufficient for economic business case to see if it is worth it. With variable speed pumps, you will get your best energy efficiency at the lowest RPM. However, you need sufficient flow to give you at most two turnovers a day which is only 22 GPM over 24 hours. Using the .03 * RPM formula gives close to 750 RPM for 22 GPM.

    I am not sure what electric power curves you are referring to but if you have one for 750 RPM, then you can determine the energy usage in 24 hours and compare it to two turnovers of your existing pump and see the difference. From the data you gave previously, your old pump required 6 hours for 2 turnovers (solar off) @ 950 watts which would be 5.7 kwatts/day.

    Here are a few more good papers/sites that I have found which goes over many of the details of pump and plumbing systems.

    http://www.pumped101.com/efficiency.pdf
    http://www.pacificliquid.com/pumpintro.pdf
    Mark
    Hydraulics 101; Pump Ed 101; Pump/Pool Spreadsheets; Pump Run Time Study; DIY Acid Dosing; DIY Cover Roller
    18'x36' 20k plaster, MaxFlo SP2303VSP, Aqualogic PS8 SWCG, 420 sq-ft Cartridge, Solar, 6 jet spa, 1 HP jet pump, 400k BTU NG Heater

  4. #4
    chem geek is offline PF Supporter Whibble Konker chem geek 4 stars chem geek 4 stars chem geek 4 stars chem geek 4 stars
    Join Date
    Nov 2004
    Location
    California
    Age
    65
    Posts
    2,226

    Default Re: Pump Efficiency, Head, Flow, and related technical info

    Mark,

    I know I'm being a mensch about this, but are you looking at this PDF file on page 47 with the graph "IntelliFlo Flow and Power vs Flow Pump Curve" and then starting with 80 feet on the left and moving across that horizontal line until it intersects the black line "Head @ 3450 RPM"? It not only visually looks almost exactly halfway between the 80 and 100 vertical lines for GPM, but it measures that way also -- possibly at 91. I zoomed in a whole lot just to make sure. If I look at this PDF file which is in the 4x160 manual on page 25, then I can get something more like 92 which is getting closer to your number. Note that there are 4 vertical lines between 80 and 100 so that is 5 sections so each vertical line represents 20/5 = 4 GPM and the intersection is at the 3rd vertical line (after the 80 vertical line) so that is 12 GPM more than 80 or 92 GPM. I suspect that you counted each vertical line as being 5 GPM instead of 4. I discovered this unusual vertical line spacing (i.e. 4 lines instead of 3) because I used a ruler to measure between the two marked vertical lines (80 and 100) and didn't worry about those intermediate lines.

    If you look at the first of the two links above showing the full IntelliFlo manual, then that graph does show the power (electrical) consumption curves for three RPM settings. That's how I got that data for my table.

    So I looked at the documents you linked to and they are absolutely fantastic. Thank you so very much! When I referred to "leakage" it's really just a recirculation that is occurring (at a net 0 GPM and maximum head). There is no output work being done. I now see that this isn't a chamber or piston kind of pump effect, but a centrifugal impeller and vane technique so if the centrifugal added velocity goes against a pressure that brings the velocity back to zero, then there will be no net flow (but because this isn't the BEP point, there will be recirculation flows and uneven pressures in between the vanes and this can damage the pump).

    The first document link you gave contained a very useful formula that helps figure out equivalent power efficiencies and identification of the most efficient point at each RPM. That is the definition of specific speed:

    Ns = n * sqrt(Q) / H^(3/4)
    or Specific Speed = RPM * sqrt(GPM) / (Head in Feet)^(3/4)

    If I add this as a column to my spreadsheet, I find that though the specific speed varies with GPM and Head, the peak (electrical input to pump output) efficiency point at each RPM corresponds to roughly the same specific speed of around 1320. So that gives me additional useful information so that I will know if I am operating near the BEP point with both solar on and off (when I get my IntelliFlo pump).

    I've made a detailed piping diagram for my system and the reason that my solar system has such high resistance is that it isn't on a single flat roof, but is on a roof with several hips so that the piping has a lot of 90 degree elbows and extra distance -- it's not at all a straight shot. There are 2 panels on one hip, 7 on another (5 higher and above 2 that are lower), 2 on another, and 1 on another. I did find a possible problem with the piping of the solar that could cause uneven flows (they didn't make the total path lengths the same throughout and instead did some Ts to return too soon so I essentially have two sets of solar panels with different path lengths). So my last 3 panels probably have lower flow than all the rest -- now I can understand why I actually saw a decrease instead of the expected increase in heat output when they added the most recent panel. They only worsened the already unbalanced situation. I'll calculate the expected flow rate difference and if it's significant, then I'll have them fix that as it should have been done correctly initially. Should be easy to fix by just breaking at the T and adding extra pipe.

    Richard
    Last edited by chem geek; 01-23-2007 at 04:40 AM.

  5. #5
    mas985's Avatar
    mas985 is offline Lifetime Member Whizbang Spinner mas985 3 stars mas985 3 stars mas985 3 stars
    Join Date
    Dec 2004
    Location
    Pleasanton, CA
    Posts
    1,423

    Default Re: Pump Efficiency, Head, Flow, and related technical info

    I was using the brochure data but the manual is much better data and yes I get 92 GPM from that as well.

    I can only find the energy usage curves for the Intelliflow. Are you assuming they are the same for the 4x160? I would check with Pentair on that to make sure they are the same.

    Ok so with updated information, I plotted your plumbing curves (solar off/on) on top of the pump's head curve. Where they cross are your operatng points. I assumed your pump was at the same elevation as your pool.


    You would get the same answer if you simultaneously solve your pump equation and your plumbing equation. So the crossover points follow the relationship of GPM = .0325 * RPM for solar off which is pretty close to what I had before. For solar on, the crossovers occur at GPM= .02 * RPM.

    The only way to change your operating points is to change your plumbing. Otherwise the efficiency is what it is at those points. However, it does sound like you have an issue with your solar so if you are able to fix that it should move that curve to the right increasing the overall efficiency with solar on.

    Good luck.
    Mark
    Hydraulics 101; Pump Ed 101; Pump/Pool Spreadsheets; Pump Run Time Study; DIY Acid Dosing; DIY Cover Roller
    18'x36' 20k plaster, MaxFlo SP2303VSP, Aqualogic PS8 SWCG, 420 sq-ft Cartridge, Solar, 6 jet spa, 1 HP jet pump, 400k BTU NG Heater

  6. #6
    mas985's Avatar
    mas985 is offline Lifetime Member Whizbang Spinner mas985 3 stars mas985 3 stars mas985 3 stars
    Join Date
    Dec 2004
    Location
    Pleasanton, CA
    Posts
    1,423

    Default Re: Pump Efficiency, Head, Flow, and related technical info

    One more point that I think you touched on in your last post but I wanted to make sure it was not lost.

    As you pointed out, energy use drops off as a cube of RPM so I think you will find that you will use the least amount of energy per GPM at the lowest RPM even if the efficiency drops somewhat with RPM. Assuming the maximum energy use is 3200 watts, here is my reasoning.

    Watts / GPM = 3200 * (RPM/3450)^3 / GPM = 3200 * (RPM/3450)^3 / (.033 *RPM)

    Watts / GPM = RPM^2 /405322.5

    So the efficiency is not likely to roll off at a rate of RPM^2, so the lower the RPM the less energy is used.

    Like I said before, if you operate at 750 RPM, you can do 2 turnovers in 24 hours and use the least amount of energy possible.
    Mark
    Hydraulics 101; Pump Ed 101; Pump/Pool Spreadsheets; Pump Run Time Study; DIY Acid Dosing; DIY Cover Roller
    18'x36' 20k plaster, MaxFlo SP2303VSP, Aqualogic PS8 SWCG, 420 sq-ft Cartridge, Solar, 6 jet spa, 1 HP jet pump, 400k BTU NG Heater

  7. #7
    chem geek is offline PF Supporter Whibble Konker chem geek 4 stars chem geek 4 stars chem geek 4 stars chem geek 4 stars
    Join Date
    Nov 2004
    Location
    California
    Age
    65
    Posts
    2,226

    Default Re: Pump Efficiency, Head, Flow, and related technical info

    Just FYI. I verified that the pump in the IntelliFlo and the IntelliFlo 4x160 are identical with identical curves and efficiencies. The only difference in the full version is the addition of a flow meter plus associated electronics to keep track of total volume so that the pump can shut off after a designated number of turnovers. That is what leads to much greater savings for certain configurations where multiple features are present (needing different flow rates) or where the system curve changes (e.g. filter gets dirty).

    Richard

  8. #8
    waterbear's Avatar
    waterbear is offline Lifetime Member Sniggle Mechanic waterbear 4 stars waterbear 4 stars waterbear 4 stars waterbear 4 stars
    Join Date
    Nov 2004
    Location
    St. Augustine, Fl
    Age
    70
    Posts
    3,743

    Default Re: Pump Efficiency, Head, Flow, and related technical info

    Quote Originally Posted by chem geek View Post
    Just FYI. I verified that the pump in the IntelliFlo and the IntelliFlo 4x160 are identical with identical curves and efficiencies. The only difference in the full version is the addition of a flow meter plus associated electronics to keep track of total volume so that the pump can shut off after a designated number of turnovers. That is what leads to much greater savings for certain configurations where multiple features are present (needing different flow rates) or where the system curve changes (e.g. filter gets dirty).

    Richard
    Actually, the actual pump itself is identical with the WhisperFlo. The only difference is the motor with all it's bells and whistles.
    Retired pool store and commercial pool maintenance guy.

  9. #9
    Join Date
    Aug 2006
    Posts
    23

    Default Re: Pump Efficiency, Head, Flow, and related technical info

    Can someone give me the short answer? Would it be more efficient(least costly to run) with the Intelliflo to have the slowest GPM to turn over 1x per day AND have the largest pipe with minimum 90's to have the lowest pressure/head???

    I am having a pool built and using the Intelliflo and my builder thinks I am too concerned with the over use of 90's and pipe size. He indicates in the past--with the regular Whisperflo he has to use eyeballs to get the head up.

  10. #10
    mas985's Avatar
    mas985 is offline Lifetime Member Whizbang Spinner mas985 3 stars mas985 3 stars mas985 3 stars
    Join Date
    Dec 2004
    Location
    Pleasanton, CA
    Posts
    1,423

    Default Re: Pump Efficiency, Head, Flow, and related technical info

    Low head loss in plumbing is a good thing up to a point. As head drops, flow rates increase but so does the power draw of the pump. The peak efficiency of a pump (GPM/Watt) is generally near the middle of the pump head curve.

    Another consideration is if you have too little head on the return but too much head on the suction side, you run the risk of sucking in air or worse, pump cavitation.

    The only down side of the opposite case (too much return head) is that it reduces the potential flow. So it is best to error on this side which is why most pool plumbing has larger suction pipes than return pipes.

    So you really need to match your plumbing system with the pump. To do it properly requires a bit of work which is why most pool builders simply do what they have done before.

    If you look at the curves for Richard's pool and the Intelliflow, with the solar off is about as low a head I would go on that pump and with solar on is about as high as I would go so I think it would be well suited for his pool.

    Usually 1 - 2 1/2" suction line and 1 - 2" return line is sufficient for most pools. If you have mutliple suction lines from pool to pad I would go with 2" lines and if you have more than 2 return lines, I would go with 1 1/2" return lines.

    2 - 2" lines is about the same head loss as 1 - 2 1/2" line.
    2 - 1 1/2" lines are about same head loss as 1 - 2" line.

    Having said all that, it is much easier to add head to a plumbing system then it is to reduce it as your PB pointed out. So I would always error on the side of large pipes and use ball valves at the pad to control and balance the head for the suction and return. This way you can adjust the plumbing system to get the most GPMs/Watt no matter what pump is put on. Plus, it is difficult to predict exactly how much head a plumbing system will have and is best to measure it after the fact.

    Also, post the details of your pool and equipement so we can comment further on the design.

    BTW 2 x 45 degree bends are only slightly better than 1 x 90 degree.
    Mark
    Hydraulics 101; Pump Ed 101; Pump/Pool Spreadsheets; Pump Run Time Study; DIY Acid Dosing; DIY Cover Roller
    18'x36' 20k plaster, MaxFlo SP2303VSP, Aqualogic PS8 SWCG, 420 sq-ft Cartridge, Solar, 6 jet spa, 1 HP jet pump, 400k BTU NG Heater

+ Reply to Thread

Similar Threads

  1. Can someone help estimate my Total Resistance to Flow (Feet of Head)
    By 1PoolNoob in forum Pool Equipment & Operations
    Replies: 8
    Last Post: 06-09-2013, 12:17 PM
  2. Recommendations For Replacement Pump Or Pump Motor (1.5" Piping, High Head)
    By ChuckDavis in forum Pool Equipment & Operations
    Replies: 9
    Last Post: 05-25-2013, 03:56 PM
  3. Confusing info from Taylor Technical support
    By fishandfly in forum Testing and Adjusting Pool Water Chemistry
    Replies: 11
    Last Post: 05-24-2008, 09:00 AM
  4. Pump Efficiency
    By chem geek in forum Pool Equipment & Operations
    Replies: 16
    Last Post: 01-22-2007, 12:59 PM
  5. Dynamic head, SWCG and 24/hr pump operation.
    By sailork in forum The China Shop
    Replies: 3
    Last Post: 07-11-2006, 02:44 PM

Tags for this Thread

Bookmarks

Posting Permissions

  • You may not post new threads
  • You may not post replies
  • You may not post attachments
  • You may not edit your posts